The speed of a website is a very important factor for SEO. For some websites, a single second can result in thousands of dollars gained or missed revenue.
Table of Contents
This is why website speed is meant to be a very crucial point. Unhappily, it is not easy to measure the website speed.
In this blog, you will find a way to measure the speed of your website using one of the most well-known WordPress tools known as GTmetrix. GTmetrix is the best tool to Test a Website’s Speed.
4 different factors of speed test
Like many other tools, the GTmetrix is best for it might seem to be useful if you perform an off-speed check. To get the best results out of it you will have to run different tests by considering all different factors.
Some most important factors of GTmetrix to test a website’s speed are listed below
1. Number of tests
You need to perform a number of speed tests to get complete data. Ideally, it would be better to perform speed tests at different times during the whole day. It’s a good idea to schedule the hourly test and take the speed test at least for 1 week.
We suggested this strategy because during the whole day, the performance of a website changes frequently based on visitor count and based on the utilization of the server box if you are using shared hosting.
The best outcome of testing your website speed frequently will be that you will be able to see the peak hours which will suggest the best time to share your website content target maximum visitors and showcase popups.
It is also stated that you will get the result by performing the test 5 or 10 times over the course of an hour.
Thus the load speed may vary over a week or a day. And this note is revealed by the GTMetrix.
2. Test locations
The test location plays an important role in your test results.
You need to choose the location of the test which is very close to the target visitors also make sure the location should be closer to the hosting server’s physical location.
If your website targets only one location then you will have to care about the test results for that particular location.
You should choose 4-5 testing servers if you want to target the audiences globally. If possible try to test in different locations for example one server from Europe, one from the US, one from Asia, and one from Australia.
It is important to register the free account to select the location from where the GTmetrix is been used.
The best sign to know that you now need to start using CDN is that if you found the page load time for a specific location is below average while targeting the global audiences.
3. Test Targets
Most of the people do the testing of the homepage only. And this is the most common and biggest mistake that can take you back. Very first thing is that your website’s homepage should have a minimum of data-intensive information. And it should load more faster.
Also, there are possibilities that your homepage is not that important that you consider. So it is very important to consider other pages too including the homepage while working with GTmetrix to test a website’s speed.
Simply you can say that your homepage’s speed is very much important but also matters in your website’s other pages. So make sure you are performing tests of some other pages too including product pages, single post pages, store pages, etc.
4. Test connection speeds/ devices
While testing the speed of a website, most people just test the desktop experience and fail to test the mobile experience.
This is a very common mistake as more than half of traffic comes from mobile.
Thus the speed of your website can be different on desktop devices and mobile devices. For example, as compared to desktop computers, mobile devices will take a longer time to load JavaScript.
So if your website has a heavy javascript file then there are high chance that your website will take much time to load as compared to the time taken by a desktop to load the website.
Another crucial factor to consider is connection speed. Your all visitors might not be using ultra-fast wired connections. For example, most of your customers might be using their phones on 4G which will even slow the page load time.
If you want to check how your visitors experience your website then you can load your website with different connection speeds and devices.
For free of cost, you can test your website on different connection speeds with GTmetrix, but if you are looking to test the website using mobile devices then you will have to pay for it.
How to make use of the GTmetrix speed test
If you want to utilize the basic features of GTmetrix to test a website’s speed then it is free of cost. You just need to visit their main page i.e. http://gtmetrix.com/. Now add your website URL and start analyzing.
We suggest you start utilizing its free features by just registering. It has so many flexible options to provide you without investing money.
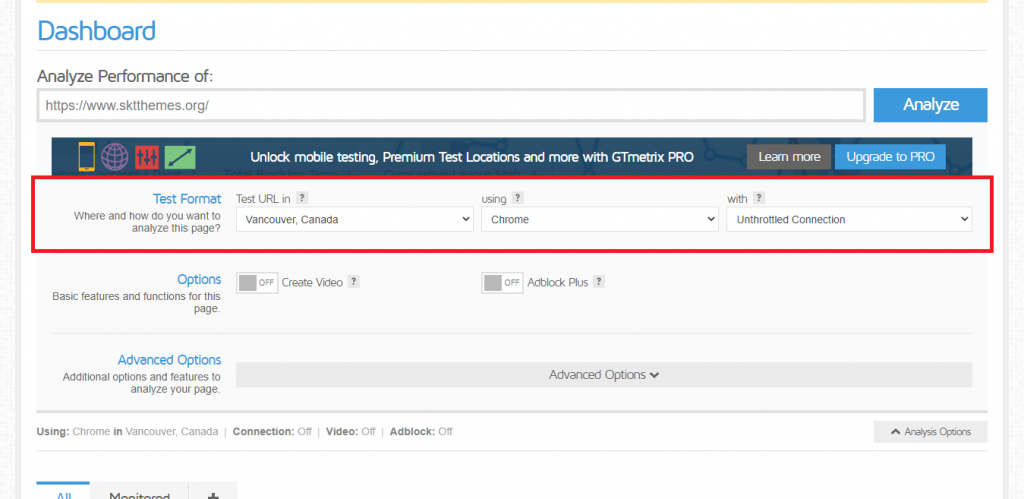
If you are taking the test without registering then you will be asked to use some configuration listed below
- Use a desktop chrome browser
- Use ultra-fast unthrottled connections
- Test from Vancouver, Canada
If the main target is Canadian then it’s OK to test it but if not then you will have to test through a different location.
While registering an account for free GTmetrix it will provide lots of features and configuration options that will help you to test on a preferable location.
- Test devices – Firefox(desktop) and chrome (desktop) for free. You can test Chrome on the Android device if you choose a paid plan.
- Location – Hong Kong(China), Mumbai(India), Dallas(USA), Sao Paulo(Brazil), London(UK), Sydney(Australia), Vancouver(Canada).
- Connection Speeds – Different options from broadband down to 56k
Access to more analysis tools will be given in a free account. After creating a free account you can
- Add the URL of your website inbox
- Click on the analysis option
To know more options in website load times you will have to choose at least two options:
- With the help of the Text URL in the drop-down, you will have to choose the location close to the targeted audiences.
- In connection drop-down choose broadband(fast).
You can select a different connection speed that suits to your needs while working on GTmetrix to test a website’s speed.
After running the test, the summary box will be displayed by the GTmetrix
The summary box consists of some important information such as
- Total page size – It will summarize that how big your website. A small website is best as compared to the larger one.
- Fully loaded time – To load your website fully how much time it actually takes(the most important factor is the loadedtime taken).
- Page speed score – Ashort estimation that your front-end website is how much optimized
- Request – Total number of HTTP request required by your website. less is a good number for this.
- YSlow score – In various sets of metrics, how your font end website is optimized will be shown here.
Do not think more about the Slow and PageSpeed scores. These two scores are important advisers. But the most important number that needs to be considered is the page load time.
How to utilize the option of advanced analysis
The example given above is the current metrics of a website. But if your main goal is to improve the website then you will find one of the best-advanced analysis tools provided by GTMetrix to test a website’s speed which helps you to know how your website is performing.
Such Metrix is divided into 6 different points:
- PageSpeed – It will mark your website opposing to 23 different recommendations provided by Google PageSpeed
- YSlow – It will mark your website opposing with 19 recommendations provided by YSlow
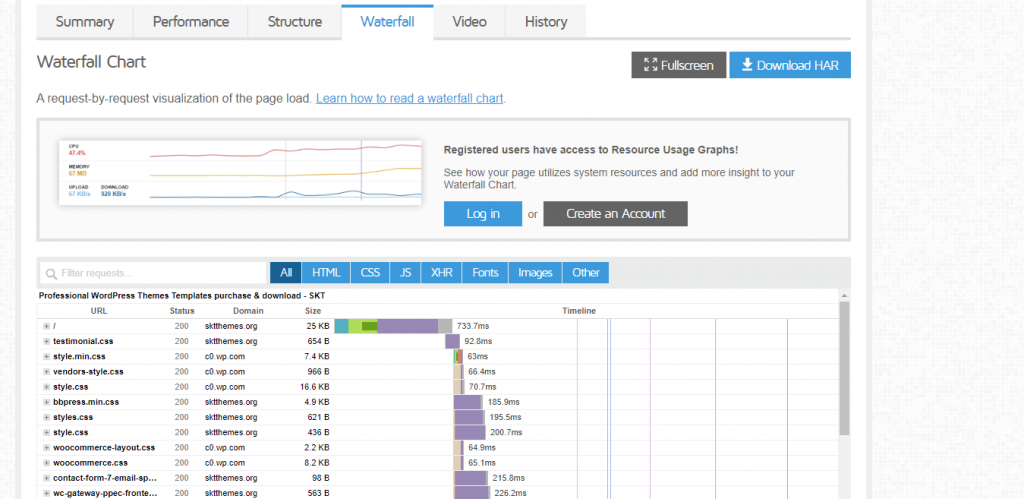
- Waterfall – This point will help understand how every single HTTP request loads on your website.
- Timings – For this, you will need a free account. For load times, you will be able to see the various timing metrics.
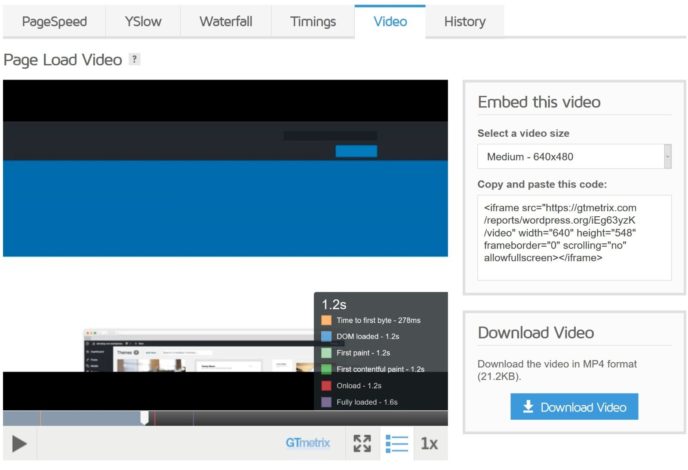
- Video – Also for this point, you will need to have a free account. It will allow you to shoot a video that how your website loads visibly.
- History – You can track the performance of your website over time.
Let us talk about YSlow and PageSpeed
YSlow and PageSpeed are the important methodologies that will help you to justify how your website’s mechanics and structure will impact its speed. It will provide recommendations in results which will make your website faster.
Some suggestions it might include are minifying assets, caching, enabling GZIP compression, adding expired headers, and many more.
The scores provided by YSlow and PageSpeed will depend on the average weighted scores that you get from separate recommendations. Some suggestions are much more important so you can see them in the priority column.
A small arrow is provided in every recommendation so that you can read more about that particular suggestion by clicking on it.
Note: Do not consider the percentage scores. The percentage can be wrong as it might show the percentage by considering a few features that are not important at all.
For example complete size in megabytes of the page(which is mainly affected due to poorly optimized images).
Rather than considering those percentages, focus on the actual page load speed which is provided in seconds. Your aim should be to get loaded on your website within 3 seconds if you want to reach your goals.
Even without getting the right score, you can have a 100% fast-loading website and it’s OK to have.
The Waterfall
To identify the traffic jam in your WordPress website speed, waterfall plays an important role. It provides complete information about each HTTP request on your website and how quickly it is loading.
Every asset on your website is a different HTTP request. An asset can be defined as a CSS StyleSheet, image files, a script, and more.
For example, if the test details box claims that your website has 26 requests that means the 26 different assets will load. This means in waterfall analysis you will have 26 different entries.
It is important to look for every asset present on your website, also it should be transferred and displayed. Every bar in the waterfall displays how every step is concentrated on every asset.
Some steps are given below that every asset goes through.
- Connecting – Total time taken to create a connection
- Waiting -The total time spent while waiting for a response
- Connecting – The total time required to resolve the DNS
- Blocking – The total time spent while waiting for a connection in the browser queue.
- Sending – The total time required to send a request.
- Receiving – To download the content, the total time taken.
Some assumptions can be made based on this information about what’s going on on your WordPress website.
The waterfall tool mentioned above checks the little vertical blue line. It indicates the point at which the DOM is loaded. Whereas the red line indicates the time the page loaded.
The TTFB (time to the first byte) is also a crucial pointer of your server speed and it is displayed by waiting for details in waterfalls.
If you are checking the high in TTFB continuously even if you have made the improvements according to the recommendation provided then it means it is because of the host server that is making your website down.
The most technical part of GTmetrix is waterfall analysis. Also, it can be considered as one of the most useful analyses. If you don’t know how this analysis works then you can see the guidelines provided by GTmetrix.
Timings
The complete information will be provided into particular milestones by the timings tab. It will tell you when and how your page gets loaded.
Example
When people start thinking of the loading time of your website, they will start thinking about the single metric.
A different definition is considered when the page is “loaded”.
Consider an example when every above-the-fold content is visible to the visitors does the page get loaded? Or whether it loads all the backend scripts when it finishes downloading, even if those scripts do not interact with human visitors.
These all are crucial distinctions when we talk about the experience of visitors to your website.
The main concern of most people is how much time will be required for them to start seeing visible content on the website. The background stuff is not the major concern for them.
Your website might take some time to get fully loaded but if you can load the content on your page quickly then users will think that your website is getting loaded quickly.
This is the main reason why Google drives the metric known as “largest contentful paint’ rather than ‘page load time’.
Use GTMetrix to test a website’s speed and timings. The timings are very helpful aspects that will major these various metrics. Some following metrics are given below that you will be able to see.
DOM loaded
Time to first byte(TTFB)
DOM interactive
First paint
Reload
First contentful paint
When you hover the mouse over the metric in question, this tab will also provide the complete information on every metric.
Note: if you have registered for a free GTmetrix account you will be able to see this report.
Video
The other most important tool is Video which will help you to measure how your website loads to the human. Some of the things given below will be discovered with this tool.
When the content is visible?
Are there any long content ‘shifts’? As additional assets load, the content will ‘shift’ or ‘jump’. You will experience such a thing when the ads get loaded on the content website and the text “jumps Down’.
Are there any unstyled content flashes? such as, sometimes when custom fonts are loading, it will take time. Thus when it changes to custom fonts from system fonts, the text will ‘jump’.
Cumulative layout shift(CLS) is the last item that is also part of Google’s Core Web Vitals.
The two different enhancements of your website loading are given below that will, the video will enable you to watch your website’s screen recording.
To 1/4 speed, the recording can be slowly downed. This will help you to see flashes of unstyled content or content shifts very easily.
For example first contentful paint, you will be able to jump to bigger timing milestones.
Google is trying its best on such user experience loading metrics. So it would be good to utilize its feature so that you will be able to find the main problem with it.
- You will have to do these two things to take a video recording
- For a free GTmetrix account, register.
- Create a video setting should be one when you start running the test.
History
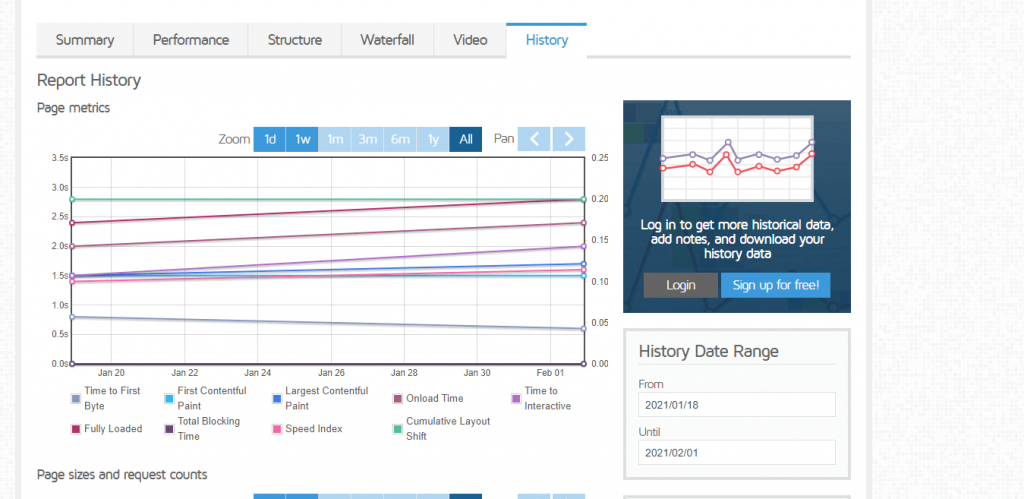
Another tab is history will permit you to see multiple test results on one page with the graph which is very easy to understand. It is important to know how over time your page load times change.
In GTmetrix, you will be able to add a note if you switch to a caching plugin or a new host to check how load time gets affected.
With GTmetrix how you can set up the alerts and automatic monitoring?
The capability of setup the automatic performance monitoring is the most useful feature provided by the GTmetrix account.
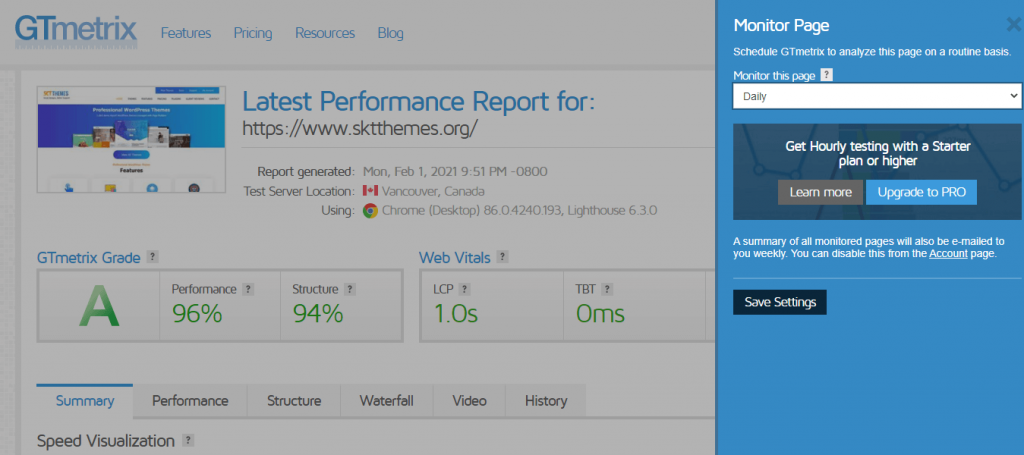
With a free account, you can make use of monitoring but actually, it is just limited. From the Vancouver, Canada server, you will be able to set up the automatic tests- you can not select the other locations of the test.
For max 3 URLs you can select from the given frequencies:
- Weekly
- Daily
- Monthly
At the top of the test result pages, click on the Monitor button to enable monitoring and configure your website’s monitor.
Your website’s email digest will be sent by the GTmetrix, thus from the history tab, you will be able to see them.
From various test locations, you can monitor the website if you pay for Gtmetrix Pro, plus you will be able to monitor the test hourly and can check some extra websites.
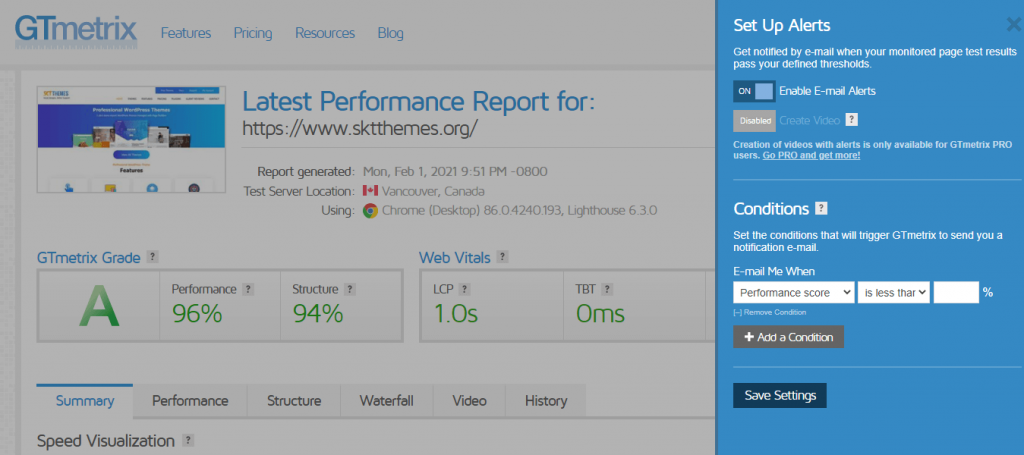
You can set up the custom alerts when you enable the monitoring- consider an example that if your page load time is more than a certain number then you can get an alert message, plus you will get the message if there is an increase of TTFB and so many other conditions.
By clicking on the setup alerts button you will be able to set these all in the interface of test results.
For WordPress users, some tips are given below
To enhance the score of GTmetrix you can implement much more things that will help you to minimize the page load times.
Some fixes are mentioned below that you can implement
- Make sure that you are using optimized servers for WordPress.
- You should choose a web hosting plan if you have non-optimized shared hosting or generic hosting.
- You should start utilizing the features of caching plugins for example WP Super Cache, WP Total Cache, WP Rocket, and more.
- You can optimize the images of your website which are taking much time to load. You can use some best WordPress plugins for optimizing the images. Some of the best plugins are ShortPixel, WP Smush, Imagify, and more.
- Your website should not consist of render-blocking JavaScript. you can optimize it with the Autoptimize plugin.
- Unwanted social media profiles should be removed from your page.
- Minify all scripts, leverage browser caching, and GZIP compression should be enabled.
- The most crucial point to consider is to delete all unwanted plugins.
- And make use of GTmetrixto to test a website’s speed.
Conclusion:
You require a tool that will help you to make your website more faster. However, GTmetrix is the best solution for you which will monitor and test your website’s speed from different locations and provide you complete details on how you can make your website perform faster.
Just make sure to test all pages of your website from different locations.

